Anyone can optimize. We grade the build.
Max projection under the cap is a solved problem: every optimizer does that math. What separates DraftEdge is what happens after it. Every lineup you build is scored against the lineups that actually finished at the top of past DraftKings and FanDuel slates, so you keep the shapes that have proven they hit and drop the ones that only look good on paper. Here is the whole path, from the first build to the morning after.
Build the lineups
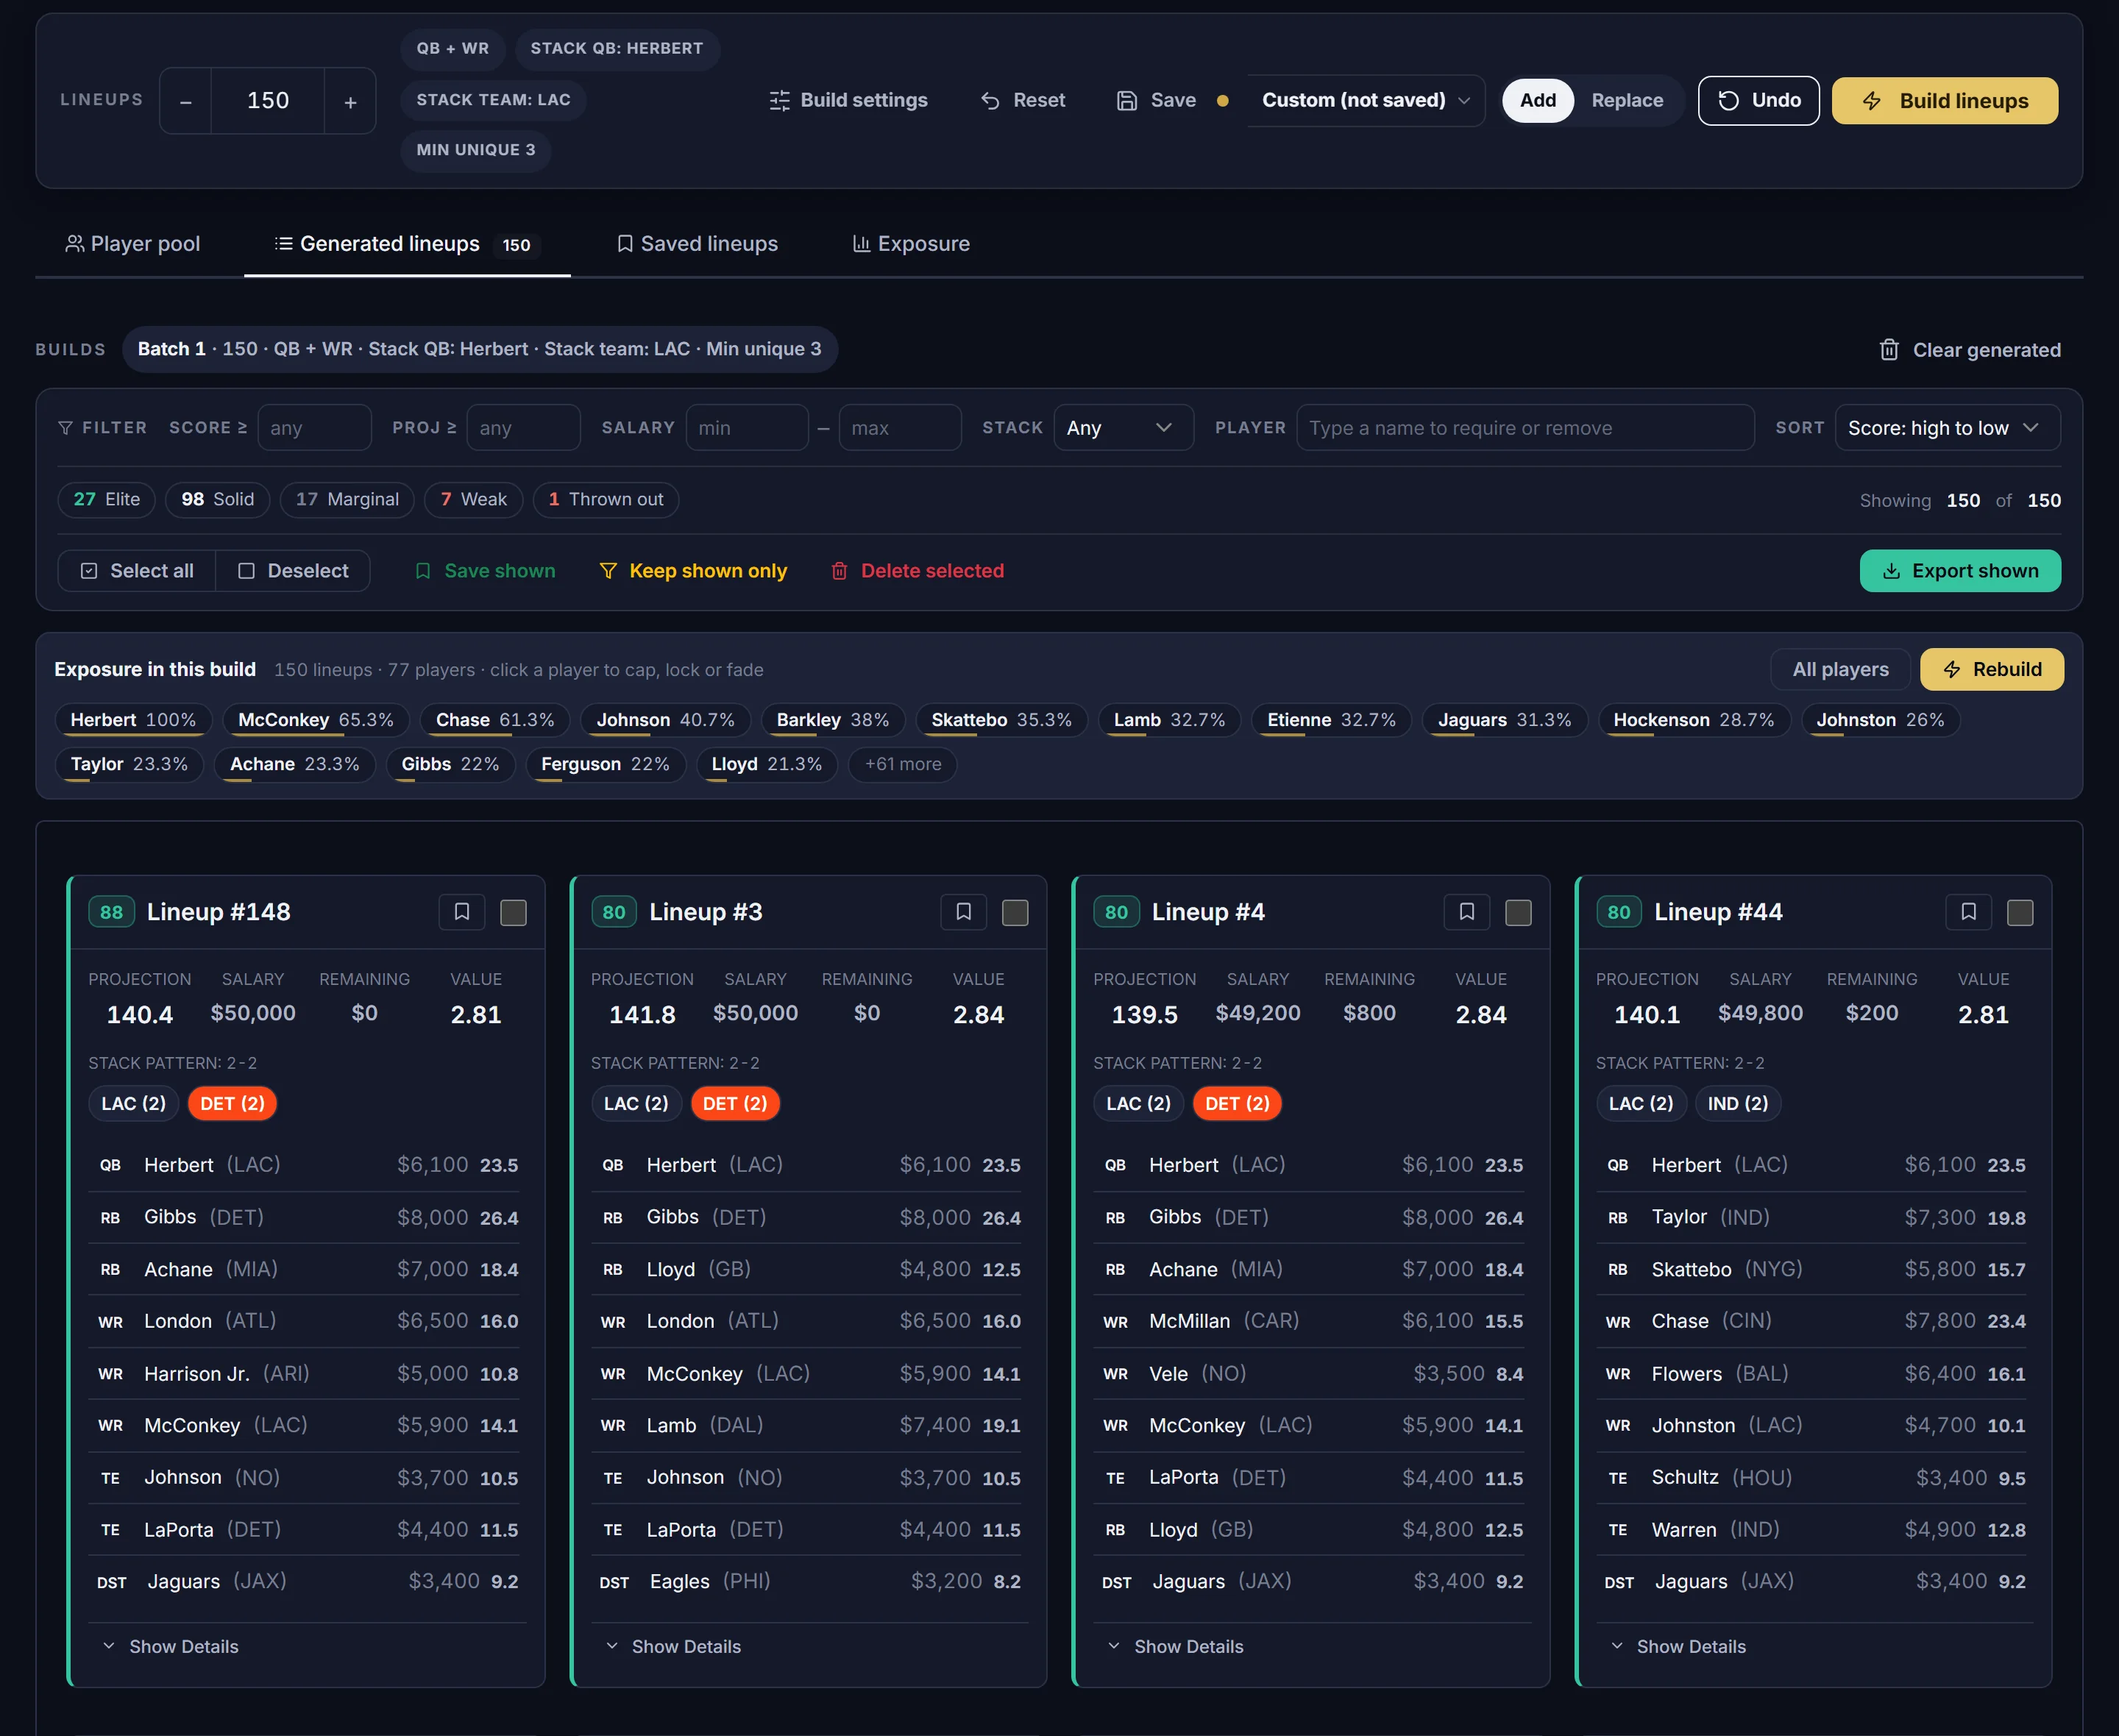
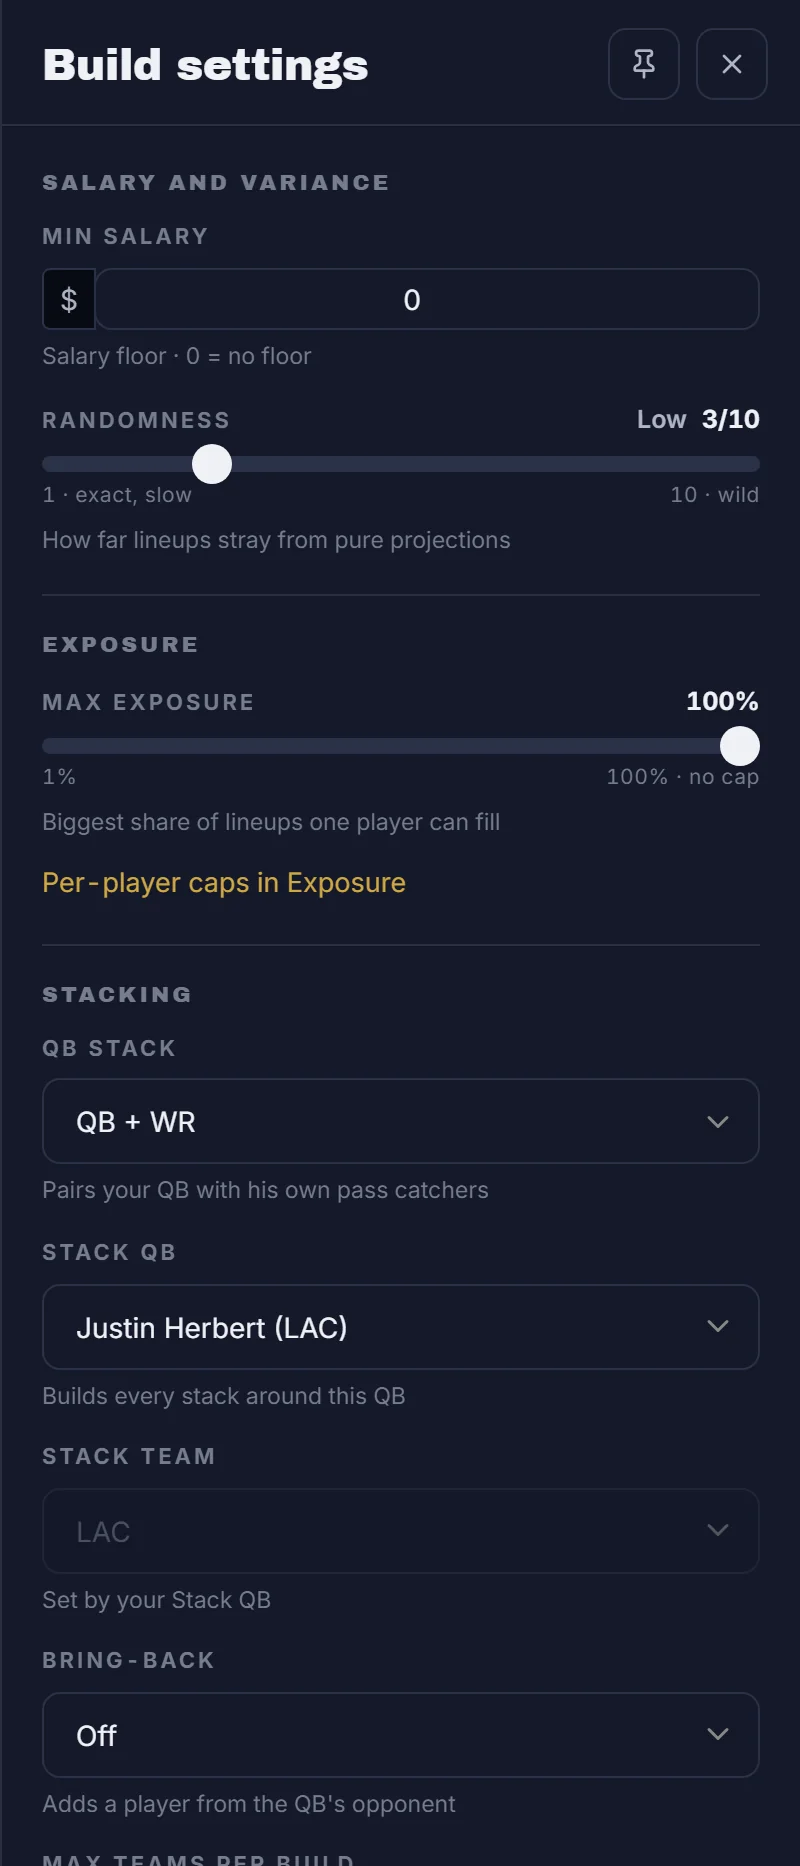
Pick the slate and the site. The projections underneath rebuild every morning before the first lock and refresh through the day, with injuries and projection movers folded in. Then tell the optimizer how you play: stack the quarterback with his receivers, bring back a player from the other side, cap how often anyone appears, set groups and rules (at most, at least, never together), and leave some randomness in.
One click builds up to 150 lineups on Pro and 500 on Sharp, in about ten seconds. Build again and the new batch adds to the pile or replaces it; your builds survive a refresh.
Score every lineup against past winners
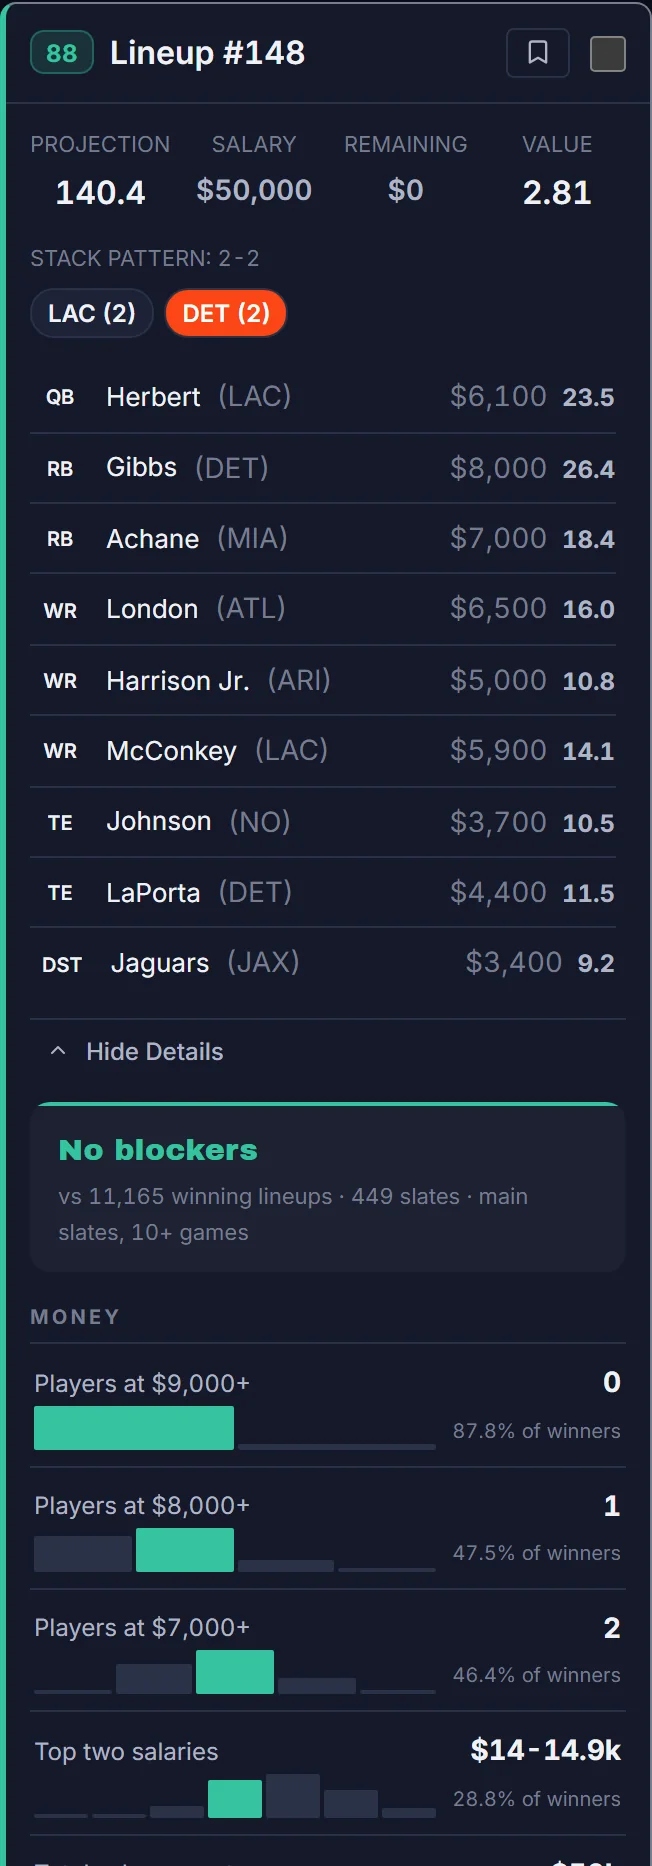
This is the part no projection can give you. For every past main slate we keep the real player pool with its real salaries, score it with the official DraftKings and FanDuel rules on the real box scores, and save the top 25 lineups by actual points. For NFL that reference set is more than 11,000 winning lineups across 449 main slates, and it grows every week.
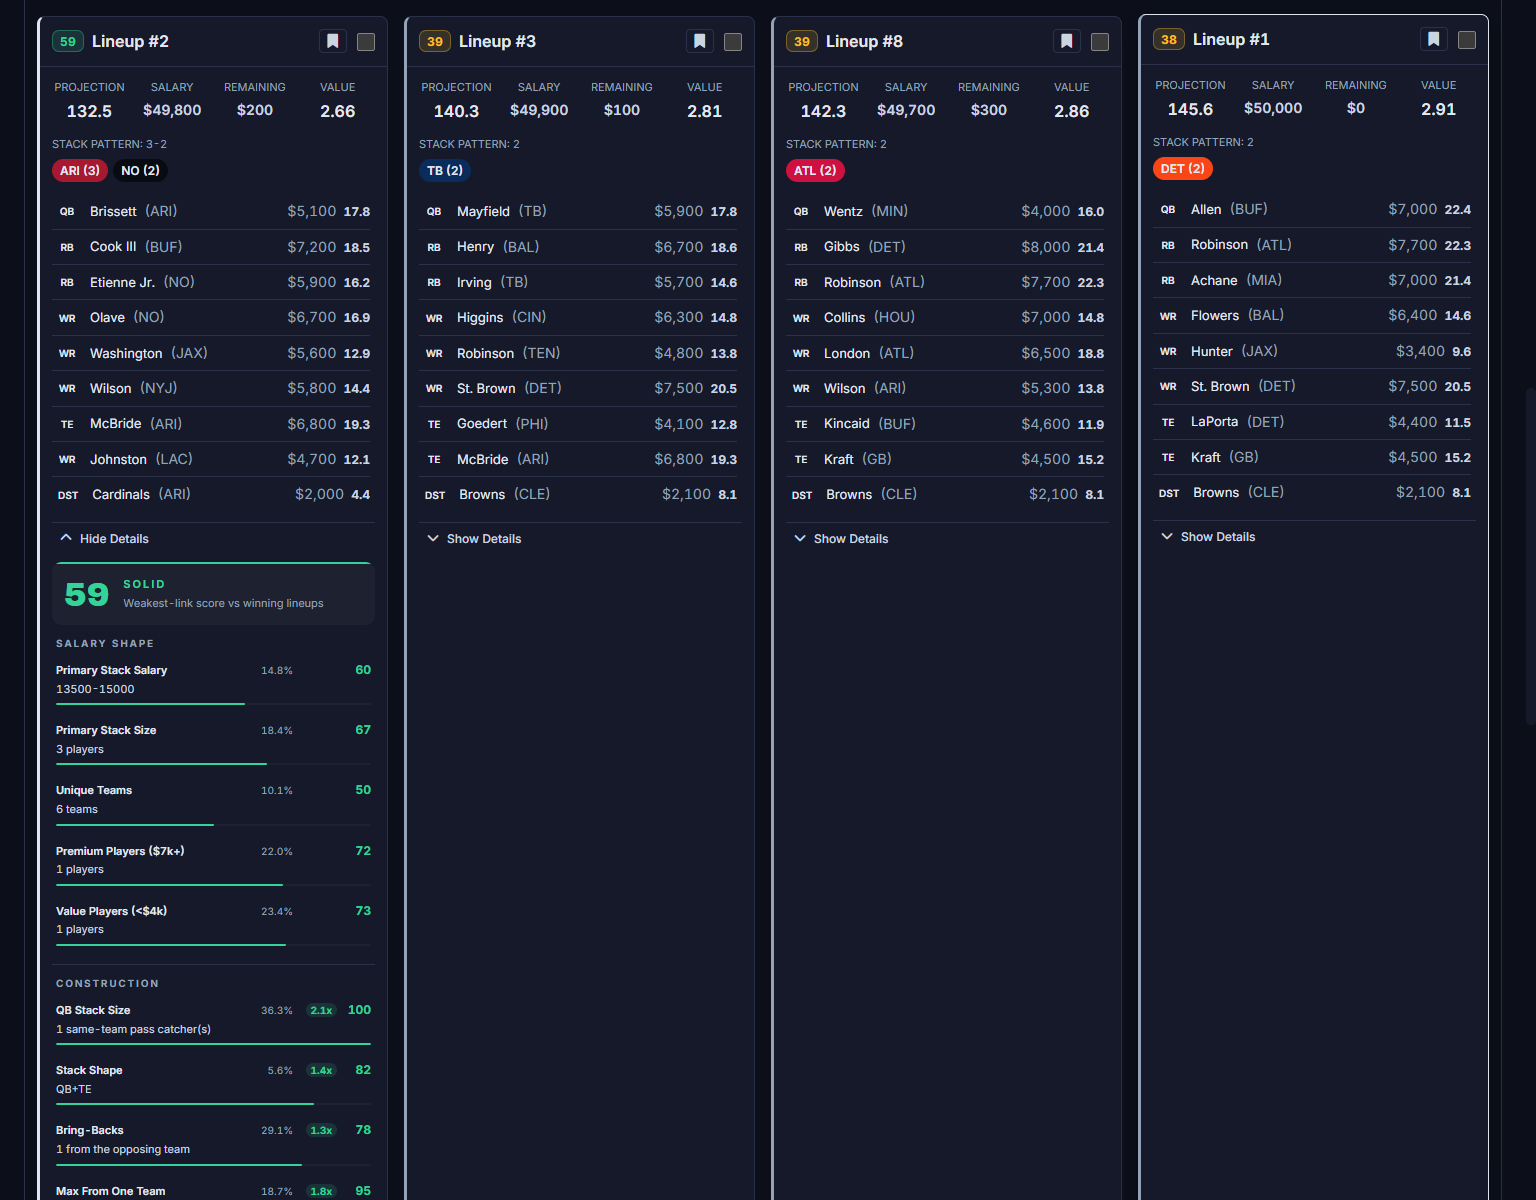
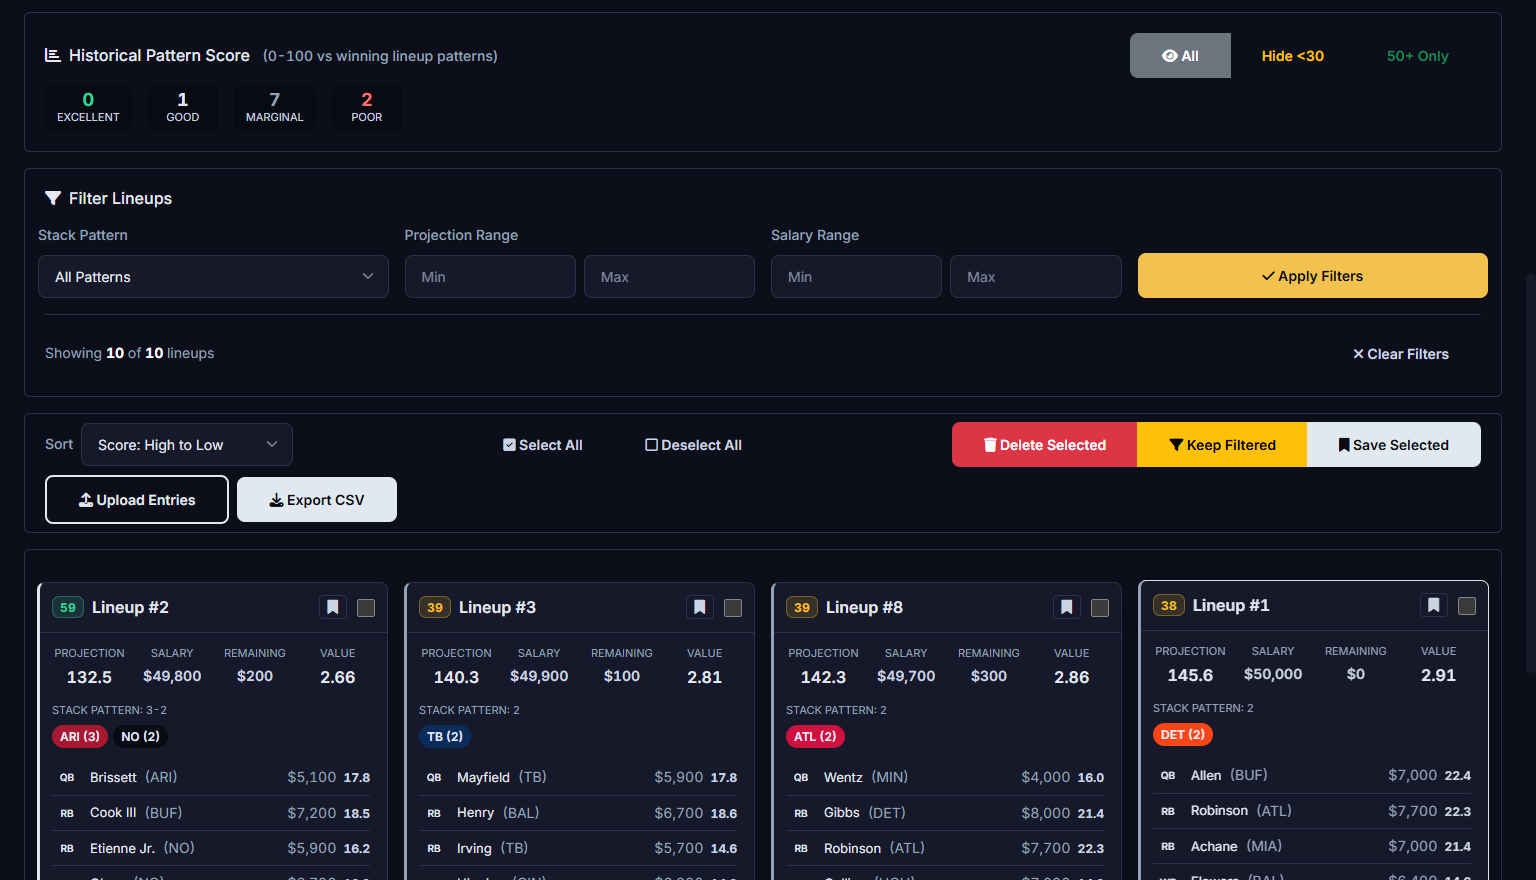
The Historical Pattern Score, 0 to 100, says how closely your lineup's structure matches those winners. It never looks at a projection. It looks at the shape of the build:
- Salary shape: what the primary stack costs, how many premium and value players you carry, how many teams you touch, how much salary you leave on the table.
- Where the money goes: the quarterback's price tier, the running back spend, the receiver and tight end spend.
- Construction: the quarterback stack size, the stack shape, bring-backs, the most players from one team or one game.
Each piece is measured as a lift: how much more often winning lineups used that choice than a random legal lineup from the same pool would. A shape no winner has ever used scores zero. The card shows the whole breakdown, bar by bar, with the share of winners that did the same thing, so you can see exactly where a build fits the pattern and where it does not.
Five tiers summarize it: Elite, Solid, Marginal, Weak, Thrown out.
Filter the pile
Sort by score. Set a floor, say 60, and the lineups below it disappear. Filter by projection, salary, stack or a player you want in or out. The tier counts update as you go, so you can see at a glance that a build of 150 produced 27 Elite lineups and one that should be thrown out.
Keep shown only, save the ones you like, delete the rest. Cash and GPP presets remember your filters for next time.

Check your exposure
Before anything leaves the page, the exposure strip shows how often each player appears across the lineups you kept. Too much of one running back? Cap him and rebuild, or drop the lineups that lean on him. The point is to enter a set of lineups you chose, not a set the solver happened to produce.

Export and enter
Export the lineups you kept as a DraftKings or FanDuel CSV and upload it to the site. Already have entries in a contest? Upload your entries file and the optimizer fills every entry from your built or saved lineups, so late swaps and multi-entry sets go back in one file.
Graded after the games
Every build is written to the lineup ledger the moment it finishes. The morning after, once every team on the slate has a box score, each lineup is scored with that site's own points. Members see all of their scored builds on their account page, and the best lineup on each main slate goes on the public record with the username that built it.
What the score is, and what it is not
A high score means the build is shaped like the lineups that have finished at the top of past slates. It is not a prediction that this lineup will win, and it does not know how many other entries hold the same players. Projections decide which players are in a lineup; the score decides whether the lineup is built like a winner. You need both, and the second one is the part we built this for.